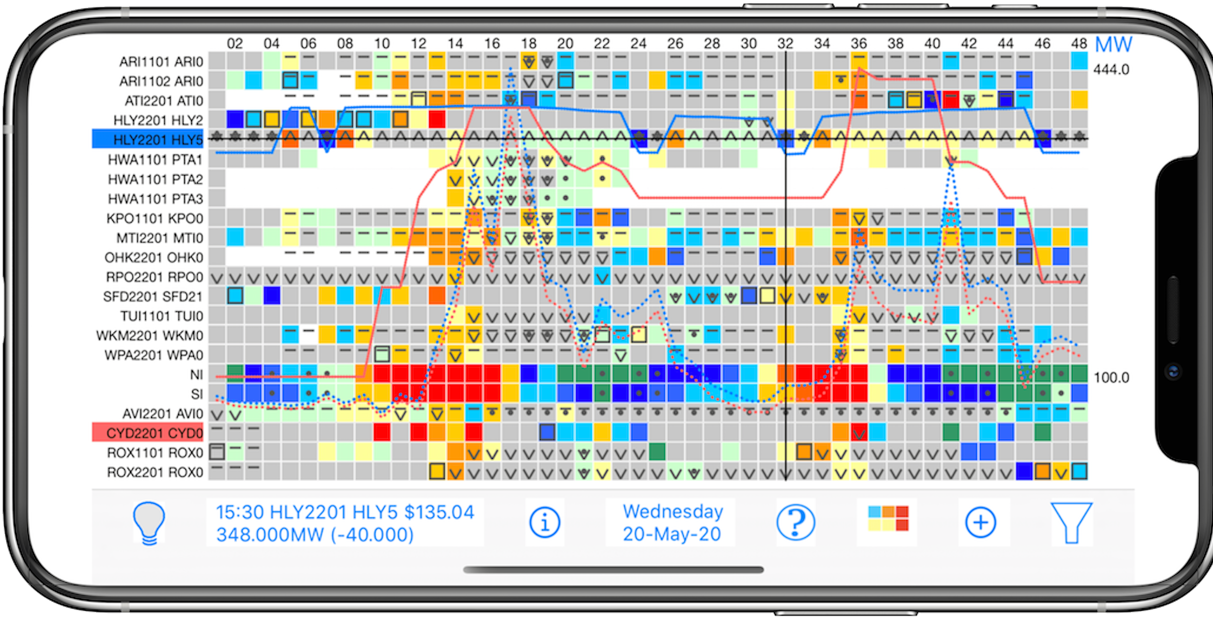
Plot options
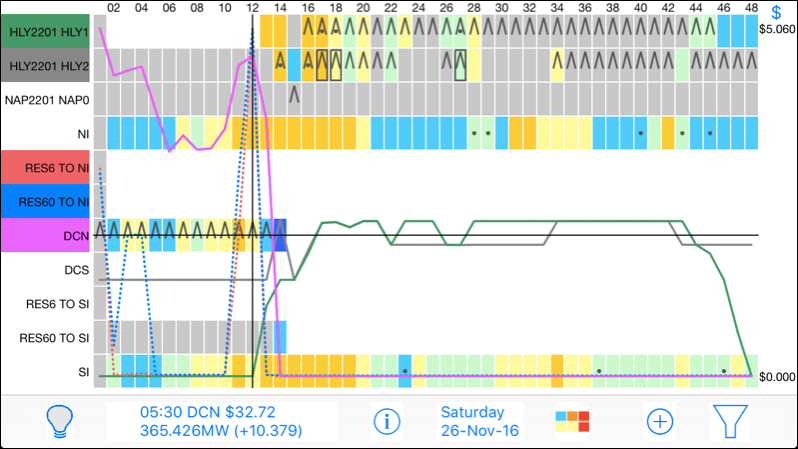
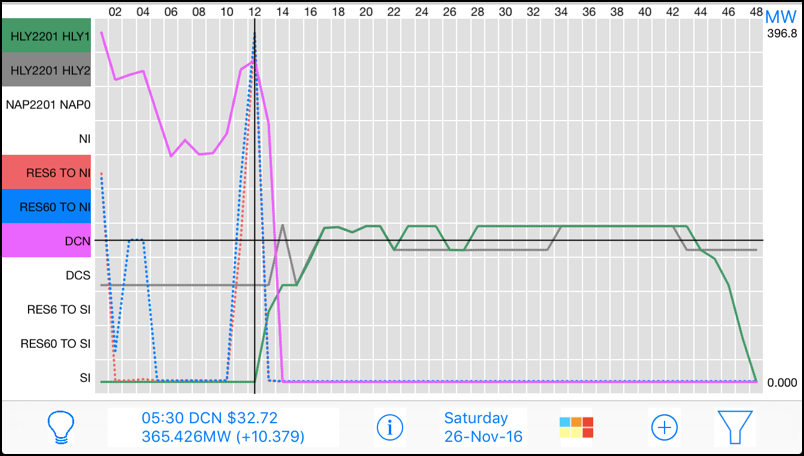
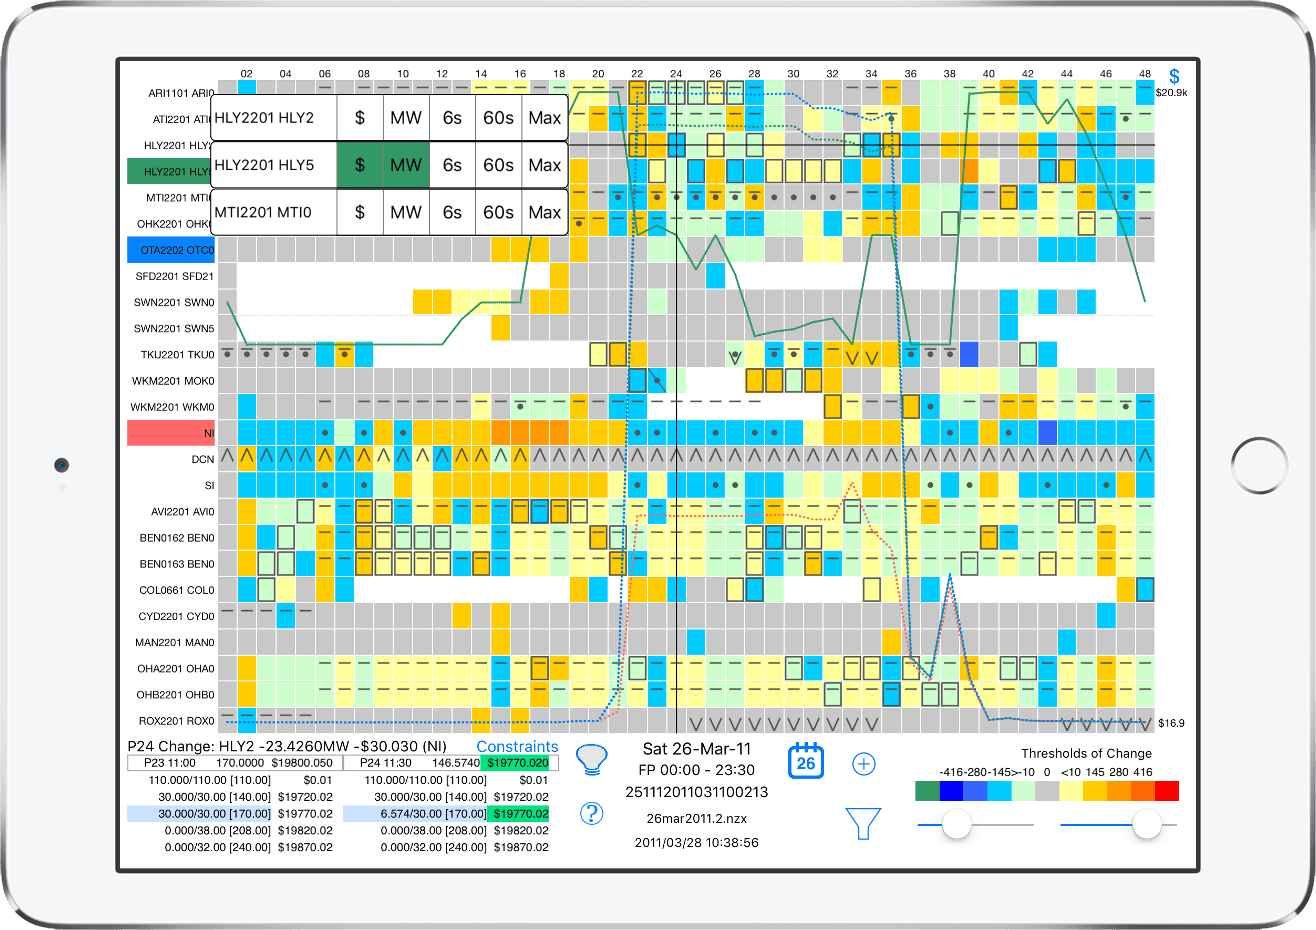
- Price and quantity can be plotted at the same time
- Price is plotted with a dotted line, quantities with a solid line
- Axis displays either price or quantity values (see Controls
section below)
- Quantity plots include generation (MW), reserve (6s and 60s) and
capacity
- For island there is also the option to plot total reserve, which
is scheduled reserve + reserve sharing
- Reserve sharing is also available to be plotted, as "Res6 To" and
"Res 60 To"
- The plotted price for reserve sharing is the reserve price for the
"to" island
- The plot selection buttons can be scrolled up and down via the
names column

Controls
The controls, from bottom left to top right, are as follows:
- The "lights out button" changes the background to grey
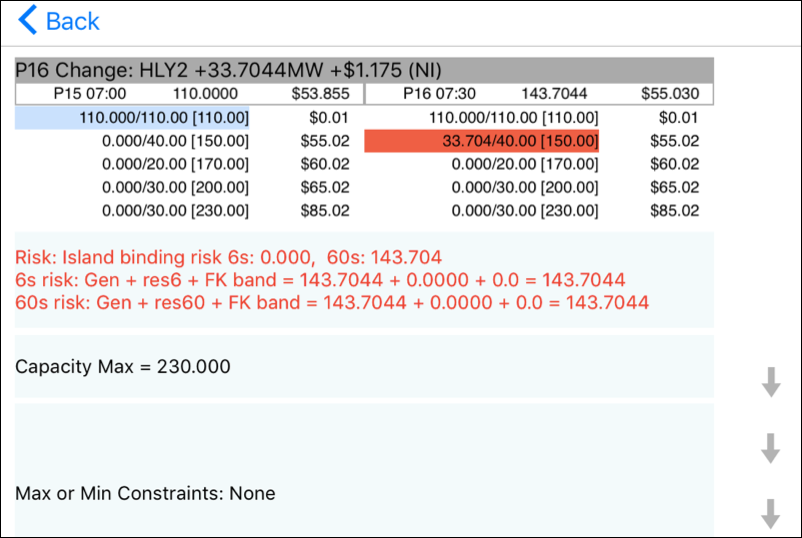
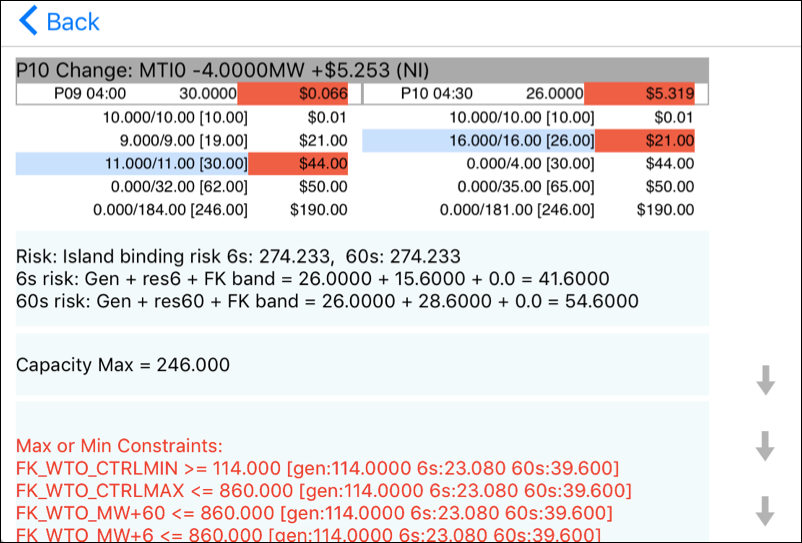
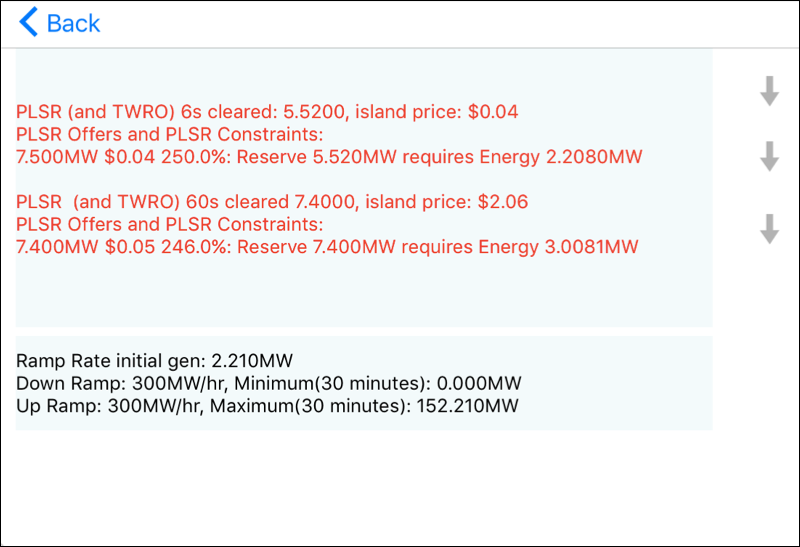
- The change summary text is also a button that leads to the offers
and constraints that produced the result (iPhone)
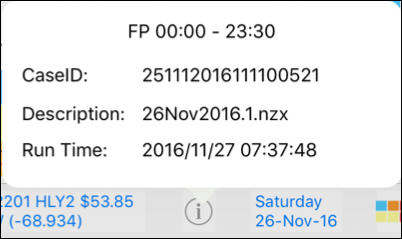
- The info button displays the case details (iPhone)
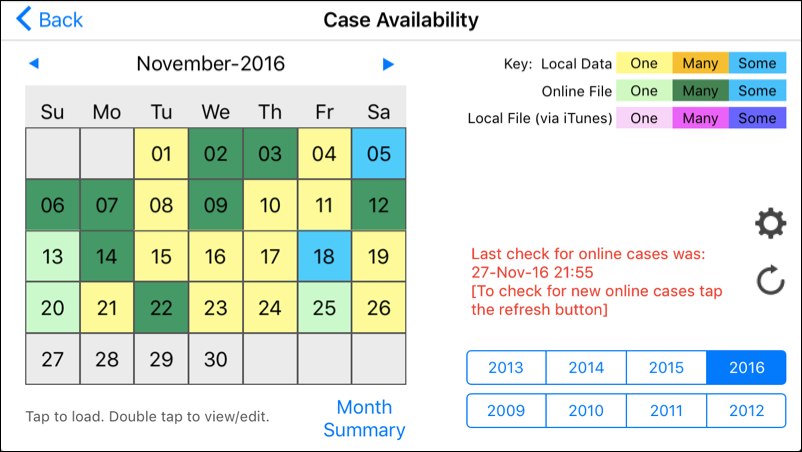
- The date time text is also a button that leads to the calendar
(iPhone)
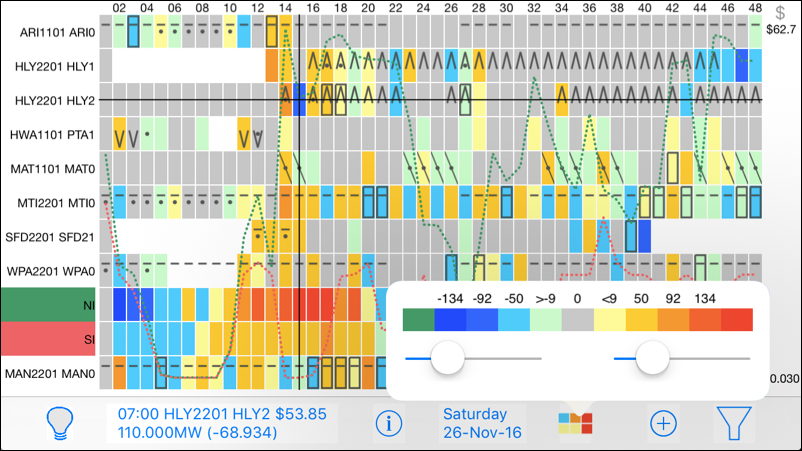
- The thresholds button displays the sliders that adjust the change
thresholds
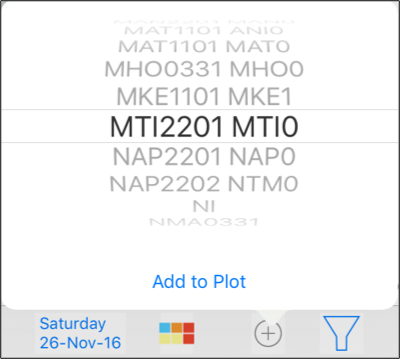
- The "+" button adds a market node to the display...
- ...the node is added by setting it to be plotted and selecting the
"show plotted" filter to "ON"
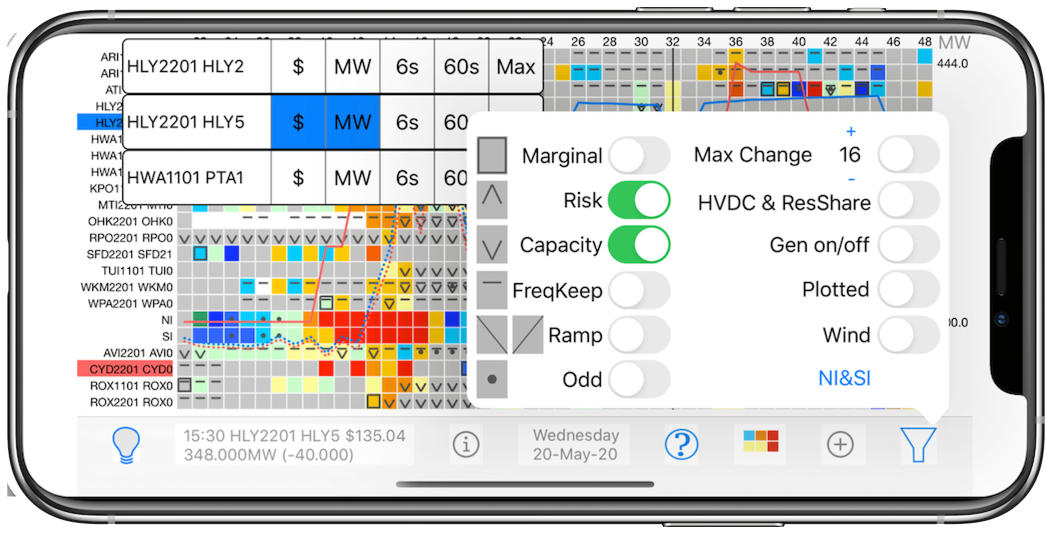
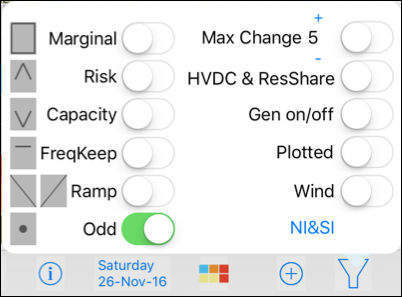
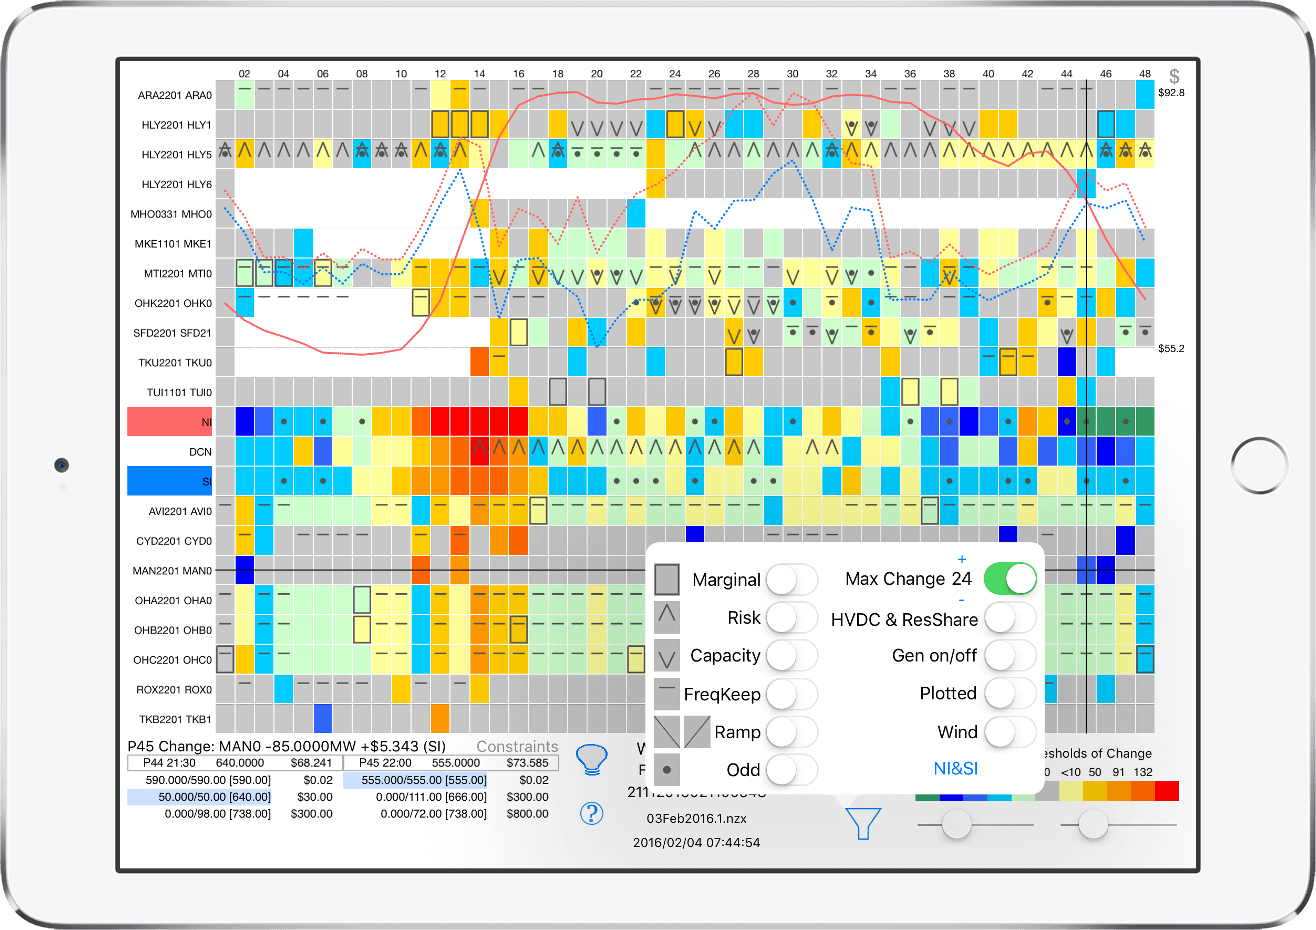
- The filter button displays the filter options, see screenshot
below
- The axis displays either the MW or $ values, selectable by the
MW/$ button at the top of the axis
Filter options
Lights Out
Add a market node to the display
Thresholds
Case Info (iPhone)
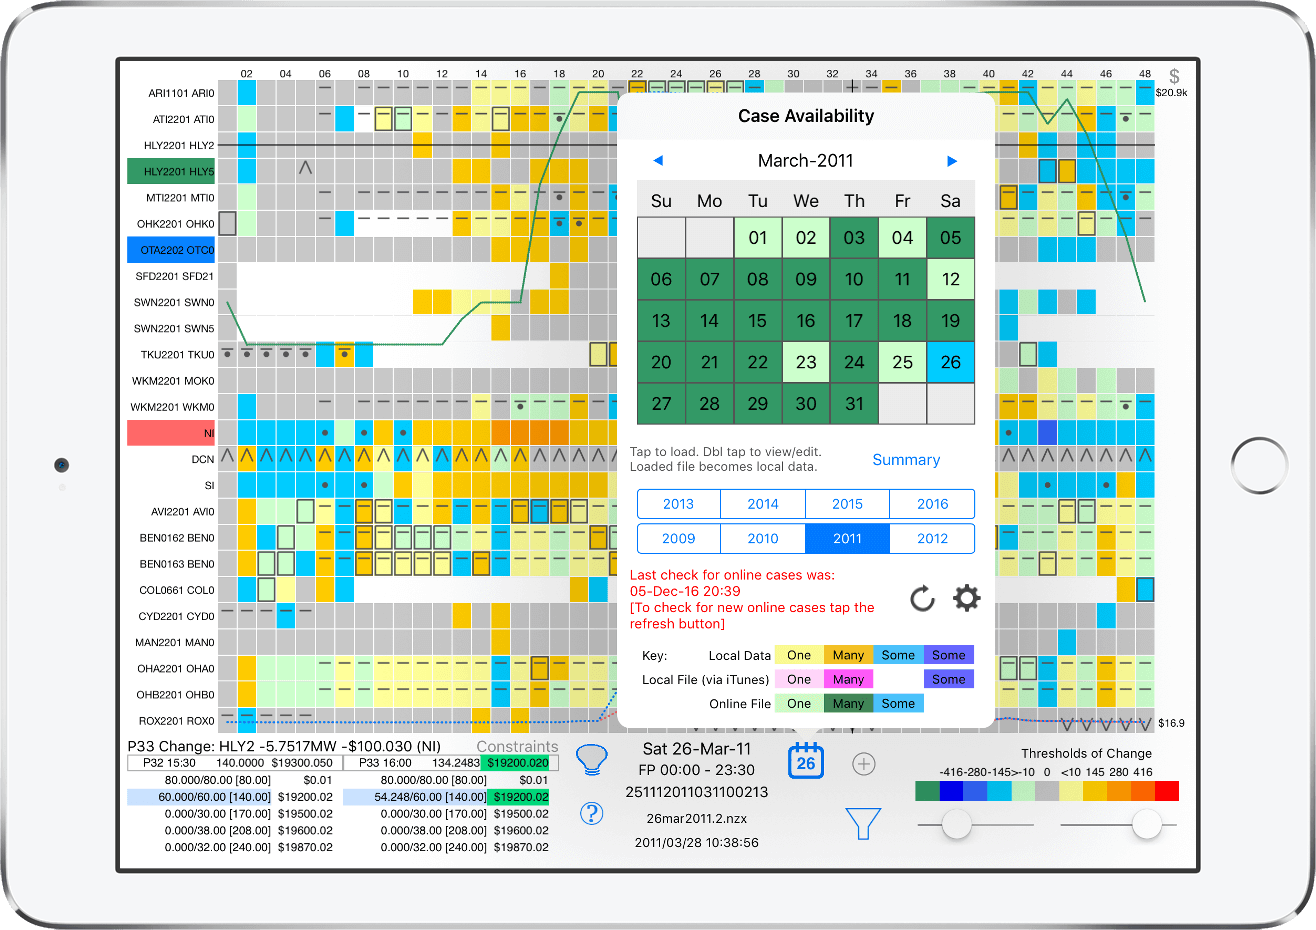
Calendar
Can also swipe the calendar to navigate to the previous/next month
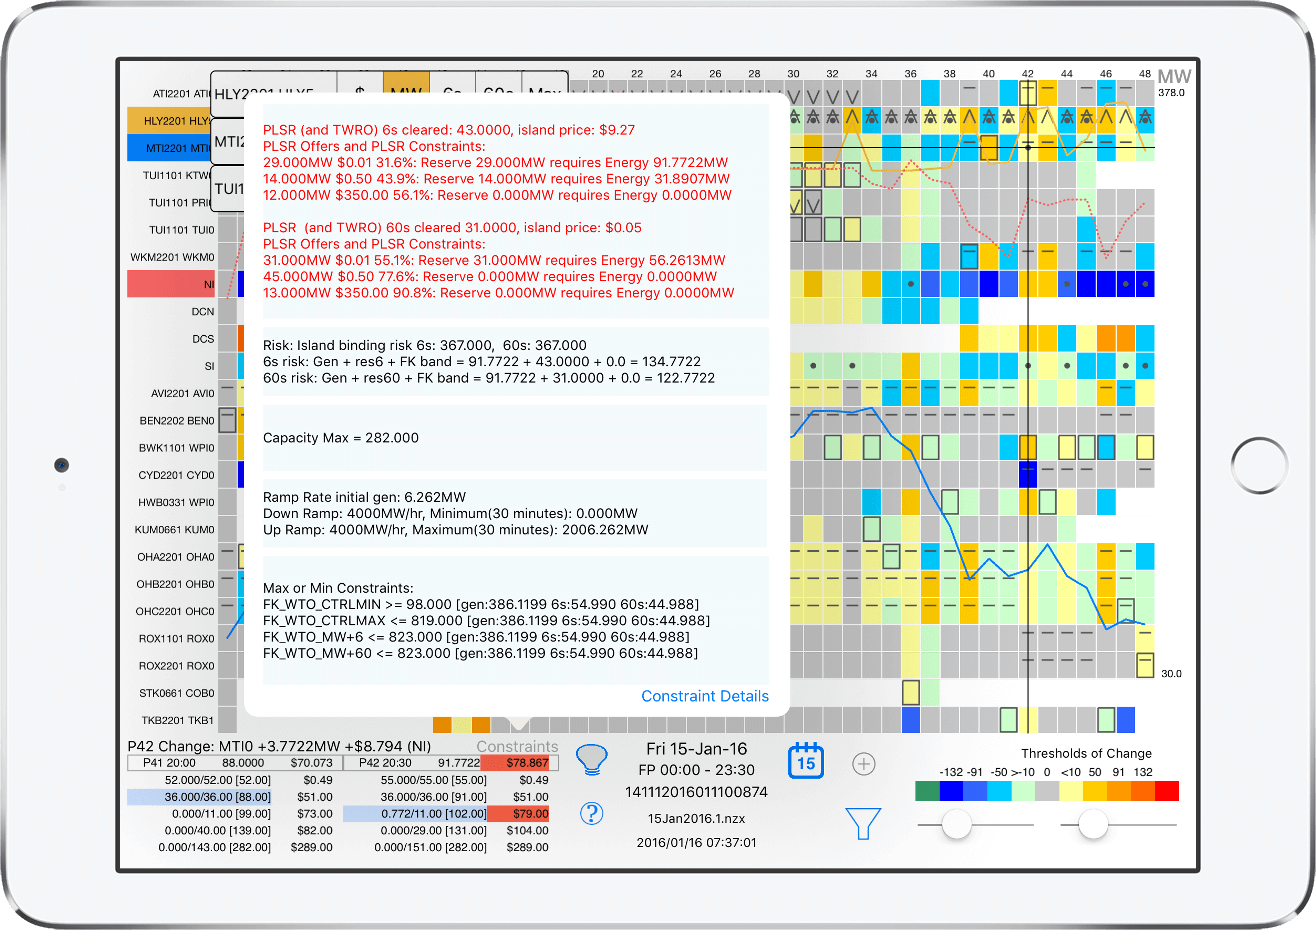
Offers and Constraints example 1
Offers and Constraints example 2
Offers and Constraints example 3
(The app downloads electricity market data from
here
)
simplexnodal@gmail.com


